13 A/B Testing Metrics That Matter [Primary, Secondary & Guardrail]


To run effective A/B tests, you need three kinds of metrics: primary, secondary, and guardrail.
Primary metrics show you whether the test variant wins and the change drives the business goal. Secondary metrics give additional insights into user behavior and help you achieve the primary goal. Guardrail metrics ensure that the change isn’t hurting the website performance elsewhere.
In this article, I’ll walk you through 13 primary, secondary, and guardrail metrics that matter for marketers and online retailers: what they mean, how to calculate them or track them in Crazy Egg and GA4, and how to optimize for them.
Primary A/B Testing Metrics
Primary metrics, also known as decision metrics, are the ones you most want to improve, because they’re the closest stand-in for a business outcome you care about.
For example, conversion rate matters because a better-converting page makes more money, so moving it moves the business.
A caveat before we dive in: the breakdown below reflects typical metric roles, but it isn’t fixed. A metric can be your primary in one experiment and a guardrail in another. Conversion rate, for instance, is usually primary, but in a test designed to raise average order value, it’s a vital guardrail.
Conversion rate
Conversion rate is the percentage of visitors who take the action you want, like a purchase, a sign-up, or a form fill.
Conversion rate is the default primary metric for SaaS and e-commerce websites because higher conversion rates mean greater business success (assuming everything else stays the same).
To calculate your conversion rates, first define your conversion event. Is it a successful checkout? Demo booked? Free trial signup?
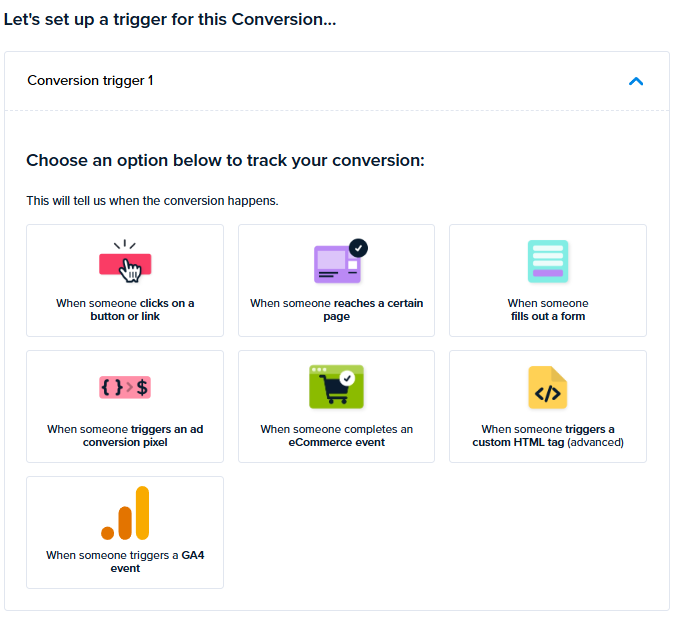
The most common way to track your conversion events is in GA4 as key events. In Crazy Egg, you can track them in the Conversions dashboard and through the Funnels. In both instances, you can use multiple triggers for your conversion events, including your GA4 key events.
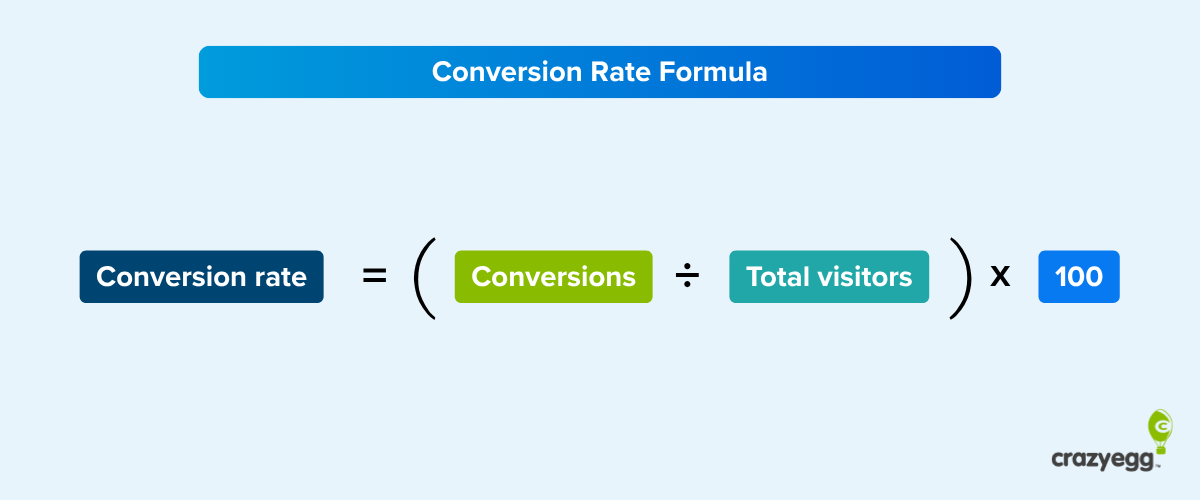
When you know how many conversion events visitors completed in a period of time, divide it by the total number of visitors over that period.
Conversion rate = (conversions ÷ total visitors) × 100
What’s a good conversion rate?
Depends. Unbounce’s 2024 benchmark put the median landing-page conversion rate at 6.6% across industries. For SaaS, it was only 3.8%, and for e-commerce, 4.2%. But that’s only a landing-page median; different page types convert at different rates.
How you improve your conversion rate depends on your page type and its root causes. Common conversion rate optimization (CRO) tactics include:
- Tightening the value proposition so it’s immediately clear.
- Cutting friction in the customer journey.
- Adding social proof and security signals (reviews, testimonials, trust badges).
Average order value (AOV)
Average order value (AOV) is the average amount a customer spends in a single order.
AOV is a revenue lever. If you increase AOV while maintaining conversion rates, your revenue will grow.
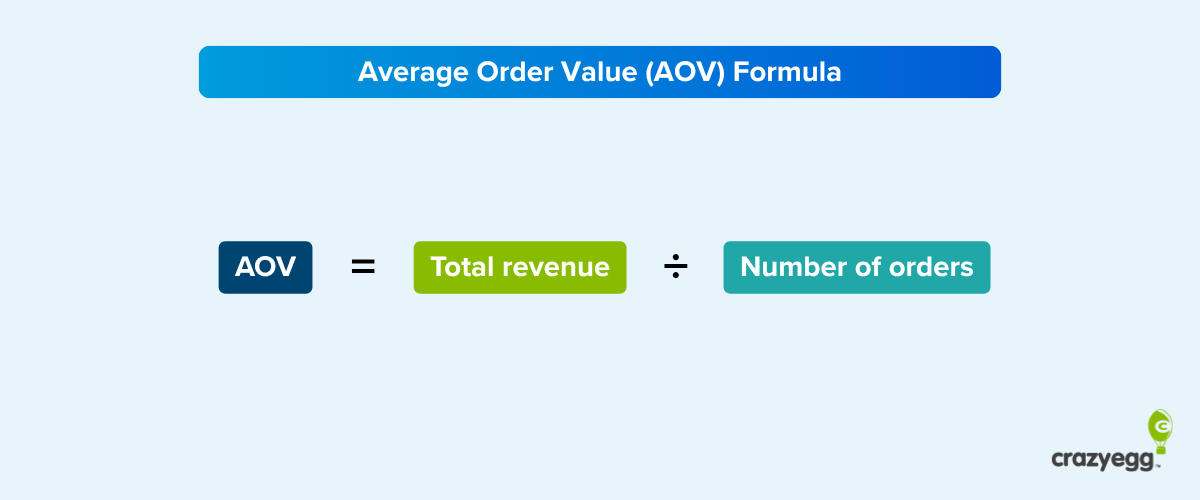
To calculate AOV, divide the total revenue for a period by the number of orders during that time.
AOV = total revenue ÷ number of orders
Possible ways to raise AOV include:
- Bundling related products or offering multi-item discounts.
- Cross-sells and upsells at the cart.
- Set free-shipping thresholds just above your current AOV.
Revenue per visitor (RPV)
Revenue per visitor (RPV) is the average amount each visitor brings in.
RPV is a strong primary metric because it captures how many people convert and how much they spend.
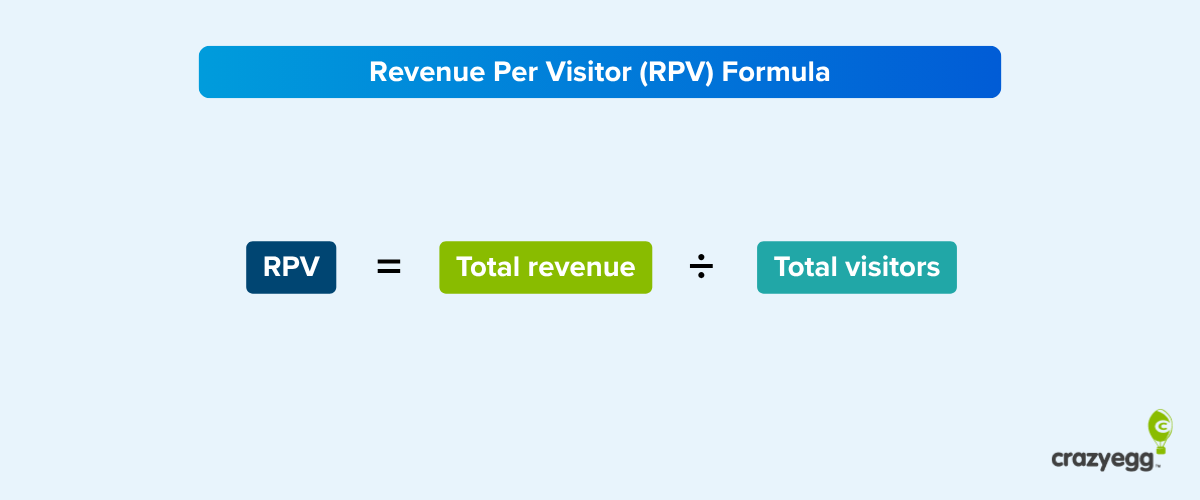
To calculate RPV, divide total revenue for a period by total visitors during that time (you can find the latter in GA4 or Crazy Egg Web Analytics).
RPV = total revenue ÷ total visitors
You improve RPV by pulling two levers:
- Lift the conversion rate (more buyers).
- Raise the average order value (bigger baskets).
Secondary A/B Testing Metrics
Secondary metrics, or diagnostic metrics, are the metrics that move the primary. They help you understand why your primary might underperform and what to change to improve it.
For example, a high bounce rate indicates the landing page doesn’t engage visitors, which has a knock-on effect on the conversion rate.
Click-through rate (CTR)
CTR is the share of people who click a specific link or button out of everyone who saw it.
It matters because without clicks, there are no conversions.
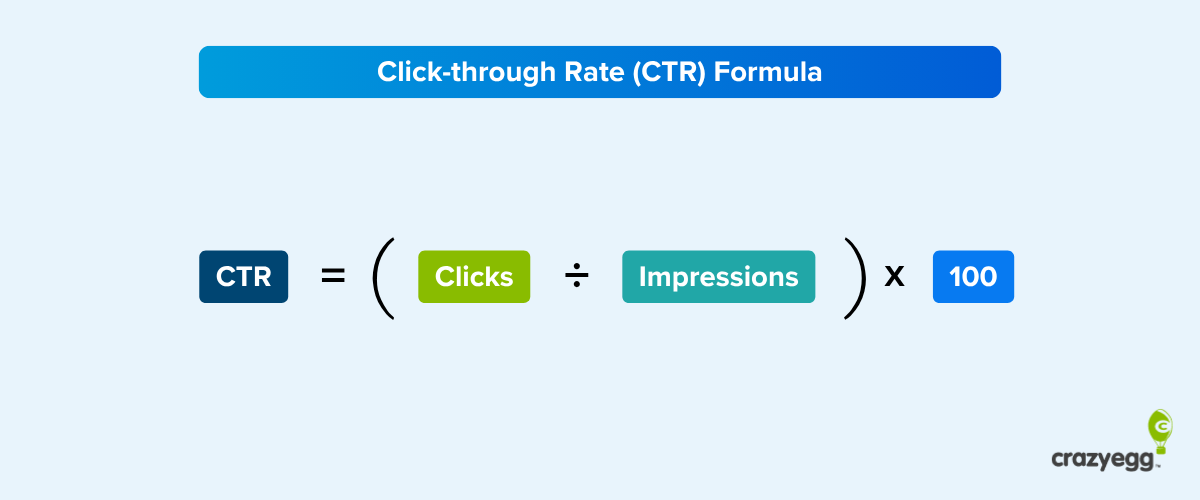
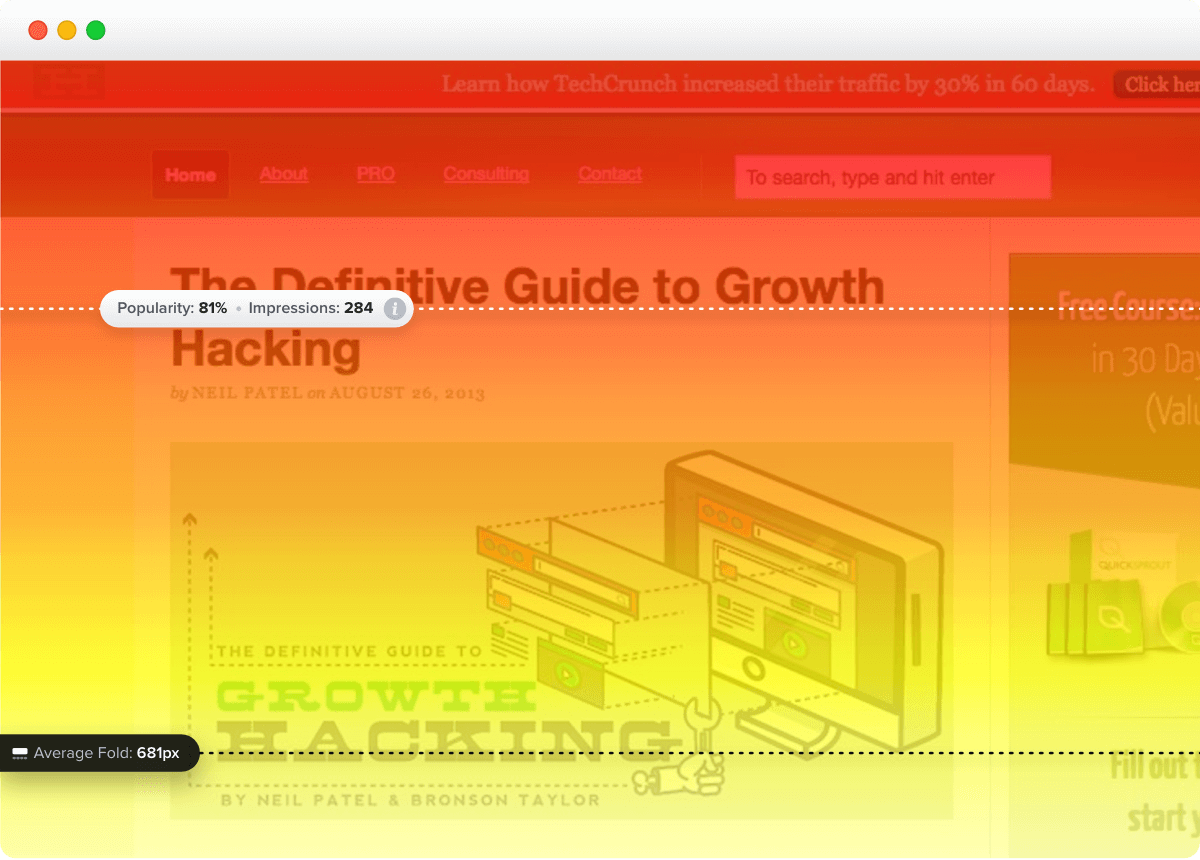
To calculate CTR, divide the number of clicks on the element by the number of impressions.
CTR = (clicks ÷ impressions) × 100
You can find the click count for every clickable element in Crazy Egg’s Overlay or List heatmap.
As a rule of thumb, impressions = pageviews. However, this isn’t 100% accurate for CTAs below the fold. To get the actual impression count for these, set up viewability tracking in Google Tag Manager.
To lift CTRs:
- Sharpen the CTA button copy.
- Raise its visibility with contrast, placement, and white space.
- Match the content to wherever the click came from, for example, the ad.
Bounce rate
Bounce rate is the percentage of visits where someone leaves without engaging.
What counts as engagement? Staying on the page longer than 10 seconds, completing a key event, or clicking through to another page on the same website. That’s how GA4 counts it.
Bounce rate shows how well the page meets visitors’ expectations and how engaging it is. It affects conversion rates: if a page doesn’t engage people in the first few seconds, they leave before they can convert.
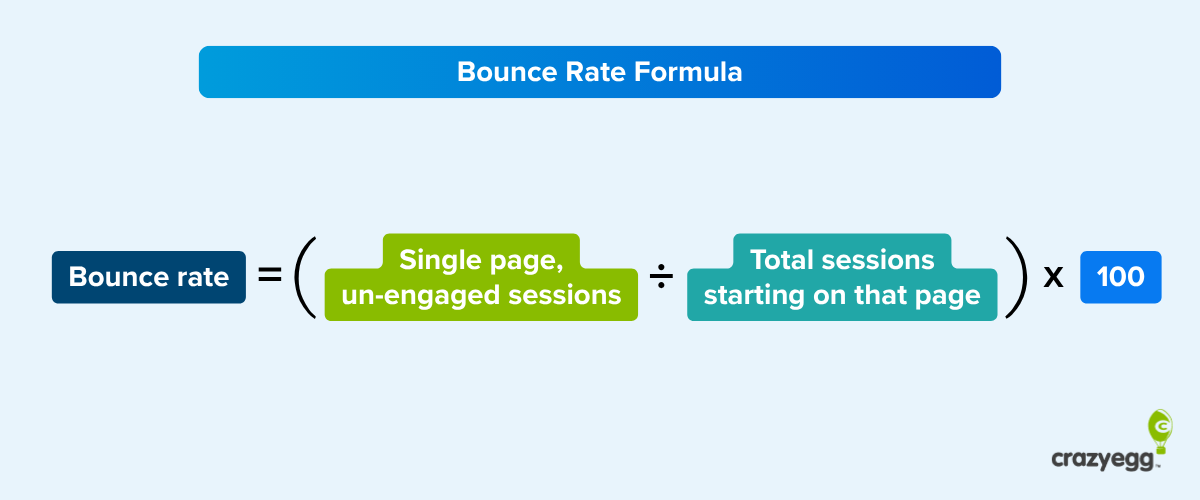
To calculate bounce rate, divide the un-engaged sessions by total sessions starting on the page.
Bounce rate = (single page, un-engaged sessions ÷ total sessions starting on that page) × 100
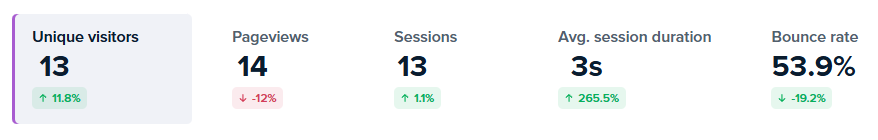
You can find the overall bounce rate for your site in Crazy Egg’s Web Analytics, and to view bounce rates for individual pages, add it to the Pages and screens report (Engagement) in GA4.
The median bounce rate is around 44% according to Databox (2024). However, this varies across industries and page types. Landing pages tend to have higher bounce rates (60–90%) than e-commerce product pages (20–40%).
To bring your bounce rate down:
- Match the page content to the ad or link that drove the visit.
- Target the right audience.
- Speed up load time.
- Invest in mobile-friendly UX and visually appealing design.
Scroll depth
Scroll depth measures how far down a page people actually get.
It tells you whether visitors saw the thing you’re testing. If your main call to action sits below the point where most people stop scrolling, conversions are low, and no amount of copy testing will fix it until you move the CTA up or find a way to make them scroll further.
The easiest way to find the scroll depth is through scroll maps.
Analytics benchmarks put average scroll depth around 50–60% of the page, and most visitors never reach the bottom.
To improve scroll depth:
- Preview the page payoff in the intro, so people have a reason to keep going.
- Make the text scannable and skimmable with descriptive, benefit-led headers.
- Break text up with visuals, charts, and whitespace.
Average session duration and average time on page
Average session duration measures how long someone spends on your website during a single visit, and average time on page measures how long they spend on individual pages.
Both are context metrics and don’t tell you much on their own. How long someone spends on a site or page matters only if we know what exactly they do and how successfully they complete their tasks. Long time on a page and low conversions could indicate excessive friction. Short time on a blog page — the article doesn’t offer enough substance.
You’ll find the average session duration in Crazy Egg’s Web Analytics, and to track the average time on page, head to the Engagement report in GA4 (Pages and screens).
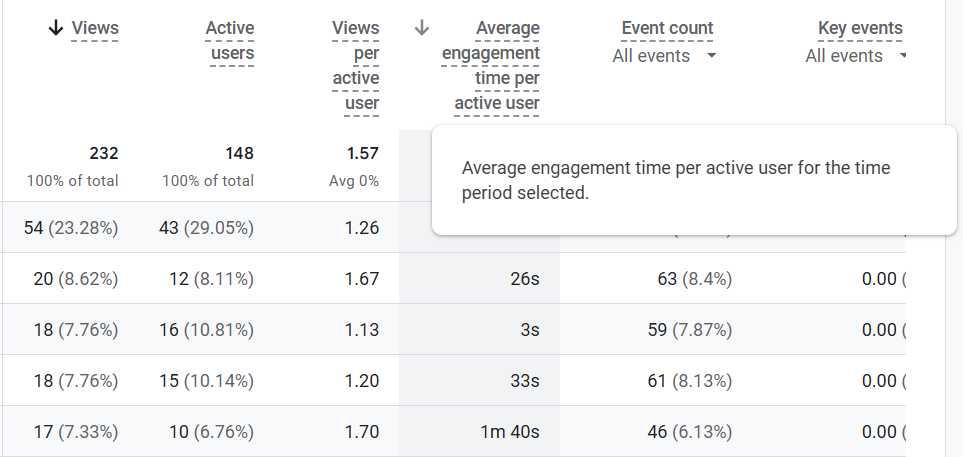
What’s a good time on page? For blog posts, 2-3 minutes, for e-commerce product pages, 1-2 minutes (longer if comparing options), and for landing pages, 1-2 minutes (less for lead-gen ones).
Abandonment rate
Abandonment rate is the percentage of people who start a task, like a checkout, a multi-step form, or a signup flow, and leave before finishing.
Abandonment rate shows the mid-funnel friction that conversion numbers don’t reflect.
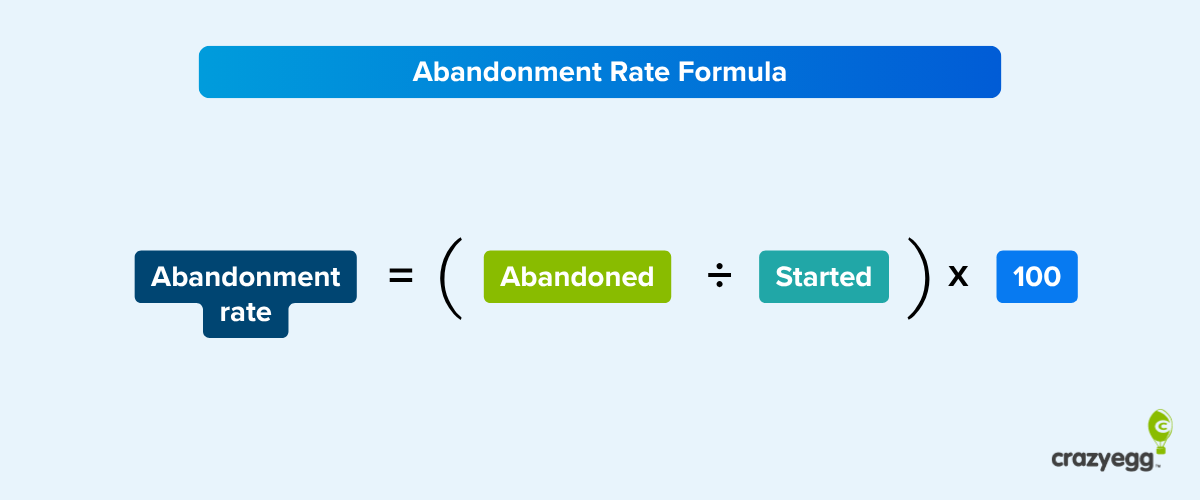
To calculate it, divide the number of abandonments by the number of visitors who started the process.
Abandonment rate = (abandoned ÷ started) × 100
You track abandonment rates through funnel explorations in GA4 or in Crazy Egg Conversion Funnels. Both show the drop-off at each step.
The abandonment rates vary, depending on the flow type. For example, the average cart abandonment rate is around 70%.
The flow type also determines how you reduce the abandonment rate. For cart abandonments, showing the total cost early and adding trust signals works. For surveys, reducing the number of questions and making them optional.
Guardrail A/B Testing Metrics
Guardrail metrics, aka safety metrics, protect you from shipping changes that improve the primary metric but are hurting your business otherwise.
For example, improving conversion rates is a false win if it hurts long-term retention.
Retention and churn rate
Retention rate is the percentage of visitors or customers who keep using the site, store, or product, while churn rate is the percentage of visitors or customers who don’t.
In e-commerce, retention rate tells you how many customers purchase again, and for informational sites, how many return to engage with the content. Churn is how many cancel their product subscriptions or never come back.
Retention and churn matter for two reasons:
- They reflect quality. Returning customers or visitors mean the product or content delivers.
- They affect profit margins. Retaining customers is 3-25x cheaper than acquiring new ones.
As guardrail metrics, they catch changes that win in the moment but hurt repeat behavior. A variation that lifts first-time conversions makes sense only if it doesn’t put off customers or visitors from returning.
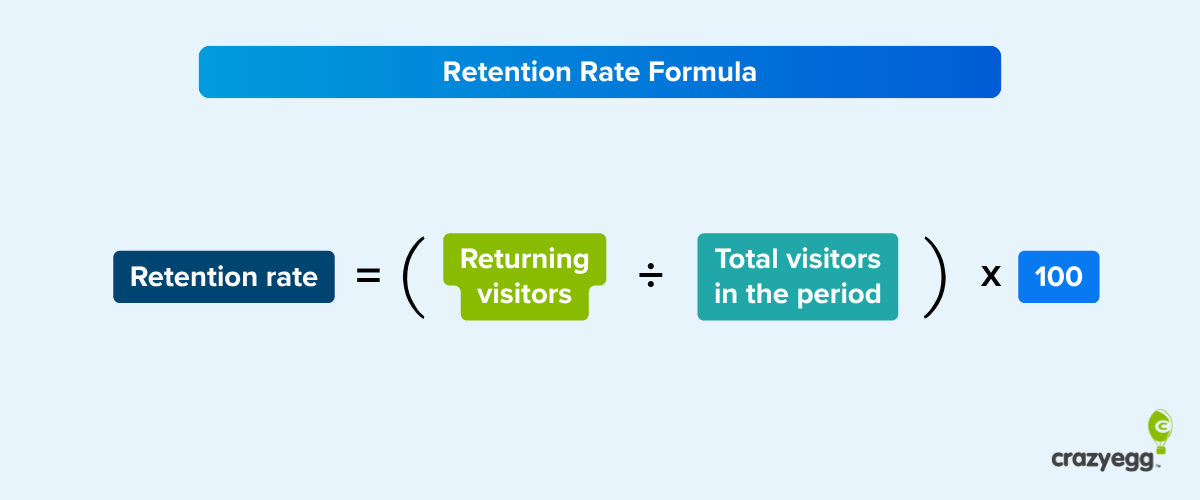
To calculate the retention rate, divide the returning visitors by the total number of visitors over a period.
Retention rate = (returning visitors ÷ total visitors in the period) × 100
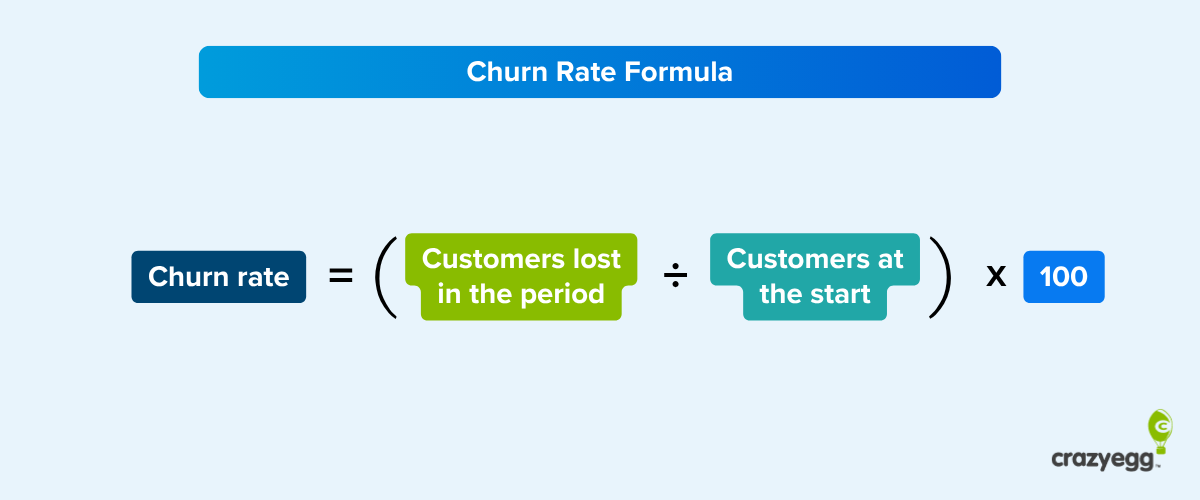
For churn rate, divide lost customers by customers at the start of a given period.
Churn rate = (customers lost in the period ÷ customers at the start) × 100
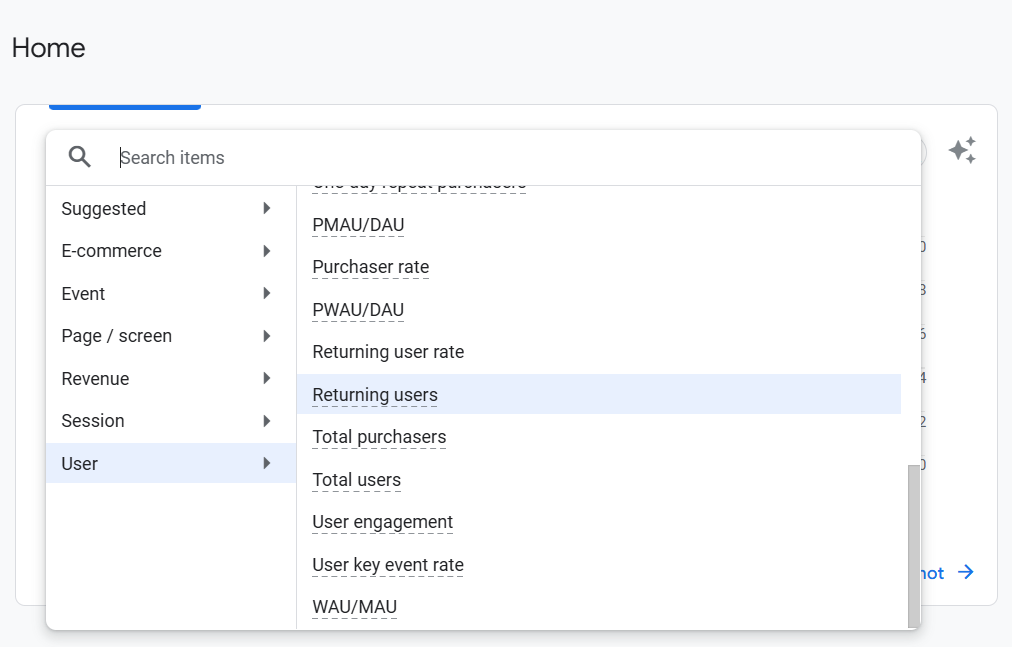
To get your retention rate in GA4, pick the returning user rate in the overview graph or use Cohort exploration.
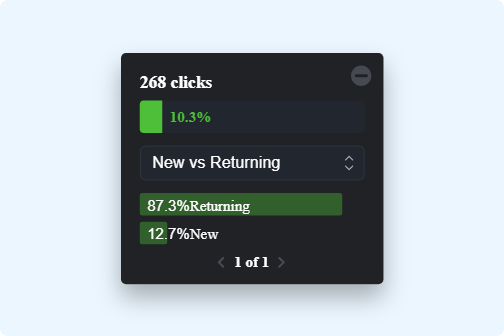
Crazy Egg shows you new vs returning visitor breakdown in Web Analytics, and you can use the segments to filter your heatmaps.

How you improve retention rate and churn rates depends on the context. For example, for an online store, it could be by offering excellent customer service, and for a blog, by creating quality content and ensuring a superb user experience.
Support ticket volume
As a guardrail metric, support ticket volume helps catch changes that introduce friction and confusion, leading to higher support costs and lost trust.
There’s no formula or universal benchmark here. Measure the change against your own baseline during the test window.
Track it in your help desk — Zendesk, Intercom, or whatever you use. To tie a spike to a specific variant, pass the assigned variant into the ticket as a custom field.
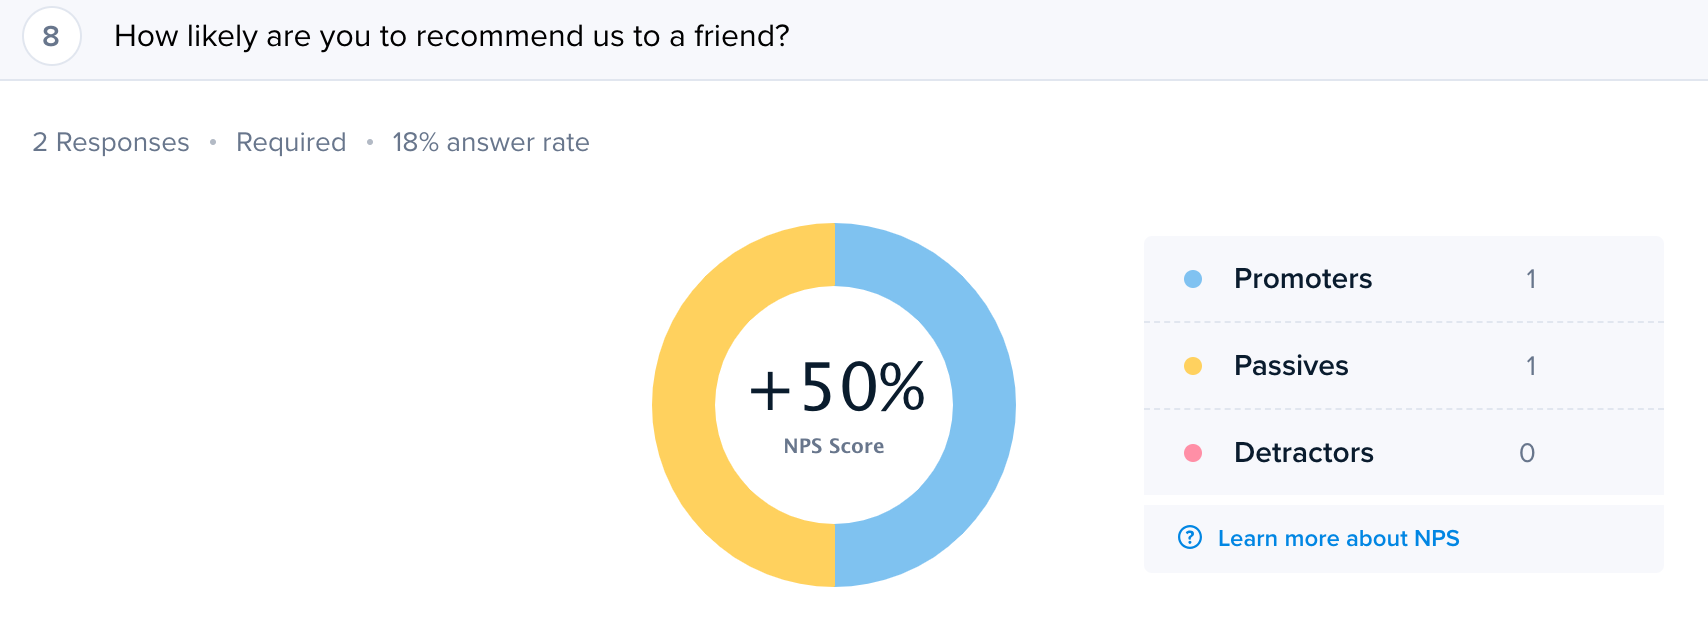
Customer satisfaction (CSAT or NPS)
Customer satisfaction measures how people feel about the experience.
The two common measures are
- CSAT (customer satisfaction): the percentage of people who rate their experience positively.
- NPS (net promoter score): based on how likely they are to recommend you on a scale from 0 to 10.
Both guard against changes that worsen the customer or user experience. Like a variation that lifts signups through manipulative tactics.
The most reliable way to collect both is through on-page surveys. Crazy Egg has ready-to-go CSAT and NPS survey templates.

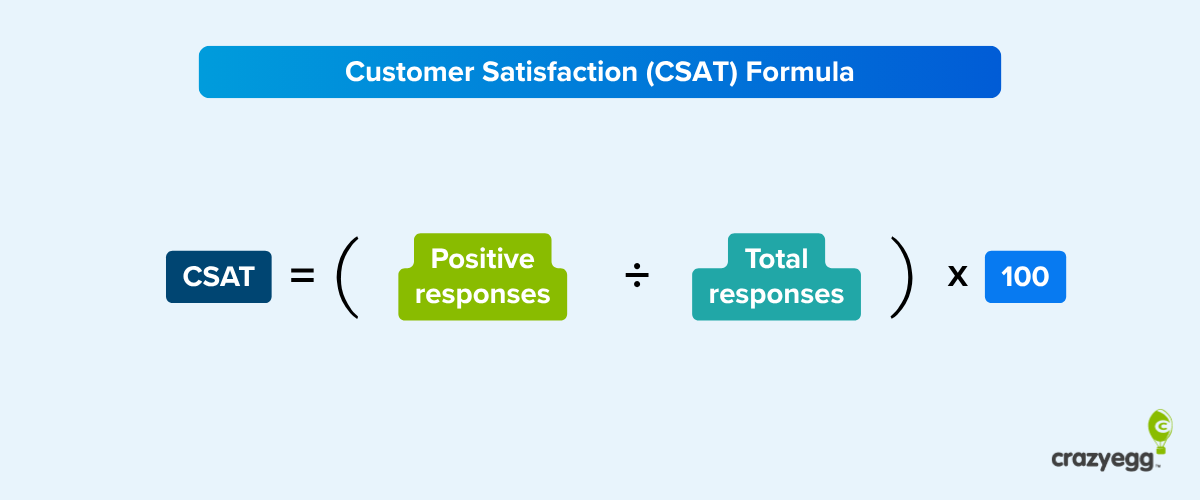
To calculate CSAT, divide positive responses by total responses.
CSAT = (positive responses ÷ total responses) × 100
Calculating NPS is more complicated, but you’re unlikely to do it manually because most survey tools, including Crazy Egg, calculate it for you.
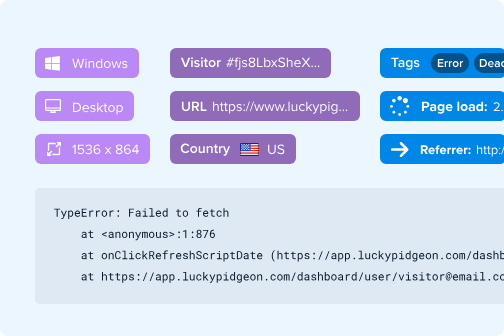
Page load time and error rate
Page load time and error rate are the technical guardrails: they catch variations that slow the page down or break it.
Track load times with GA4’s site-speed data or PageSpeed Insights, and watch for JavaScript errors with Crazy Egg’s Errors Tracking.
Run your A/B Tests and Track Your Metrics in One Place
Every A/B test requires a primary metric linked to business goals, and a set of secondary and guardrail metrics that inform variant design decisions and ensure you’re not hurting other aspects of performance.
Crazy Egg brings the testing and the tracking into one place. You can run the experiment and read the metrics behind the results: conversions in funnels, clicks, and scroll depth in the heatmaps, customer satisfaction in surveys, and more.
Start your Crazy Egg free trial now.
Frequently Asked Questions
How to choose the right A/B testing metrics?
Start with one primary metric closest to the change you’re making that ties to a business goal, like free-trial sign-up rate.
Build the rest around it.
Set guardrails — the metrics you don’t want to harm while chasing the primary, such as churn and customer satisfaction — and secondary metrics that move the primary. For example, improving bounce rate and click-through rate usually improves signups.
How many performance metrics should you track in A/B testing?
Track one performance metric per test to keep it focused. Around it, add two to four guardrails to protect what you don’t want to break, plus a few secondary metrics to explain why the primary moved.
What should you do when your A/B test metrics disagree?
When your metrics disagree, look at their roles. Ship the variant if it outperforms the control on the primary metric won, and every guardrail holds.
If a guardrail slips or a secondary metric contradicts the primary, work out whether it’s a real trade-off or a tracking bug, then retest.
If the primary dropped or a guardrail broke past its threshold, kill the variant, however good the secondary numbers look.
What is a proxy metric, and when do you need one?
A proxy metric is a faster, leading indicator that stands in for a result you can’t measure immediately. For example, if your true goal is three-month retention, you can’t wait a quarter on every test, so you track an early signal that reliably predicts it, like first-week activation.
What are common mistakes when analyzing A/B test results?
The most common A/B testing mistakes include calling a winner before the test reaches its planned sample size or statistical significance, ignoring seasonal fluctuations, declaring victory on a secondary metric, and skipping segmentation (e.g., mobile vs desktop).
What are A/B testing best practices?
A/B testing best practices include building a data-driven hypothesis and setting primary, secondary, and guardrail metrics and their thresholds/baselines before the test, iterating on the test results to seek further improvements, and keeping a record of every test, so you don’t re-run dead ideas.

